Nicholas builds tools that make data engineering and analytics
delightful
Data leader, software engineer, and sometimes an academic
Currently pushing the frontiers of Analytics Engineering at
HubSpot
Recent posts
My most recent blog posts and in-progress notes.


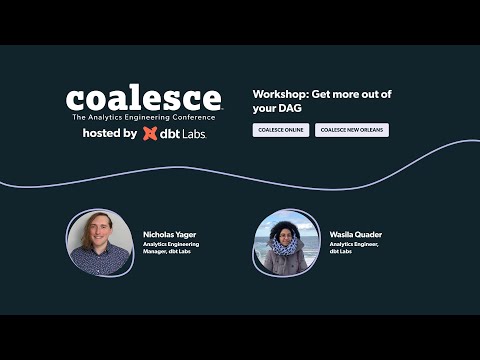
Recent talks
Sometimes, I give presentations about data engineering techniques and tools. Other times, I present workshops on the black magic of undocumented APIs and the internals of open-source software.