-
Python Buffalo: Web Scraping for Good
The topic of the September joint Python Buffalo/Data Science meet-up is data scraping. To finish up our conversation of how we can use python to scrape data from public sources, I presented a short slide deck on the ethics of web scraping. The general thesis is that it very much depends on what you are doing and how you do it, and that in the end we should all strive to be good members of the data community. Presentation.
Read more...
-
Visual Guide to DBSCAN Clustering
Clustering has become an everyday process for grouping together observations based on similar factors. This is particularly true when working with spatial data. For some of my ongoing research into applying spatial Statistics to fluorescence microscopy, I’ve been applying DBSCAN to binary images of fluorescence-tagged chromosomes to localize chromosomes. The Scikit Learn Pnython library provides a blisteringly fast DBSCAN implementation that can cluster 78 million observations in 6 seconds.
Figure 1: Real time DBSCAN clustering of two sets of normally distributed points in a field of noise. A JS implementation of DBSCAN classified sets of two-dimensional coordinates as being either noise or one of two (or more) clusters. As a general warning, the data used for this example are randomly generated on page load, so it's possible to identify more than two clusters in this dataset due to the non-deterministic nature of both the data and DBSCAN.
As I continued working with the algorithm, I started to think that it would be interesting to see the process unfold step by step for a set of data. To that end, I’ve created an annotated step-by-step guide to how DCSCAN clusters data.
Read more...
-
The Great Photo Escape: Freeing Images from Kodak's Digital Prison
Starting in 2011, Kodak brought to market the Kodak Pulse line of digital photo frames. In addition to SD card and USB support, this line of photo frames had an email address which could receive image attachments, store the images on Kodak’s servers, and display the images hassle free on the digital photo frame. While this feature is a boon for people who like to receive photos from friends and family with minimal latency, there is one very important feature missing – the ability to download these images in bulk.

Figure 1: Steve McQueen as Captain Virgil Hilts in the 1963 film _The Great Escape_. Captain Virgil Hilts is one of many prisoners of war imprisoned in a high security POW camp during World War II. While I acknowledge that using this allusion is dangerously close to invoking Godwin's Law, the movie is a masterpiece that deserves the occasional mention.
While it was possible to manually download each image using a web browser, this is not an acceptable means for backing up images, particularly if your photo album contains thousands of photographs. Instead of trying to download all of these images manually, I decided that a programmatic solution must exist. To that end, I created a bulk image crawling script using the python library scrapy.
Read more...
-
Creating Cellular Automata: Life-like Cellular Automata
In a continuation of understanding models of life, one of the most interesting cellular automatons is a two dimensional “life-like” automaton. The first life-like automaton was created by John Conway in 1970, and was published in the October 1970 release of Scientific American. The intrigue that surrounds the automaton comes from the emergence and self-organization of highly complex patterns as the simulation evolves. As a result, these automata have attracted the interest of computer scientists, mathematicians, biologists, and physicists.
<img class=lg src=https://s3.amazonaws.com/nicholasyager.com/assets/2014-06-01/cellular.png alt=”Cellular automata” />
Figure 1: An example of life-like cellular automata. This simulation is represented as Unicode characters from an automaton implemented in python. White characters represent cells that are alive. As the simulation progresses, it approaches a state of stability and order. Some patches of complexity remain and migrate through the world.
Let’s examine the rules of Conway’s cellular automaton and see if we can implement a simple life-like cellular automaton in python.
Read more...
-
Creating Cellular Automata: Elementary Cellular Automata
Sometimes the best way to learn about something is to create it. If I want to learn about an interesting subset of mathematics, eigenvalues perhaps, the explanation of the math can only go so far. I must let my pencil do the talking as I learn through construction. Programming is no different. So, when I became interested in cellular automata, I decided to make some examples of different types. Today, we can go over elementary automata.
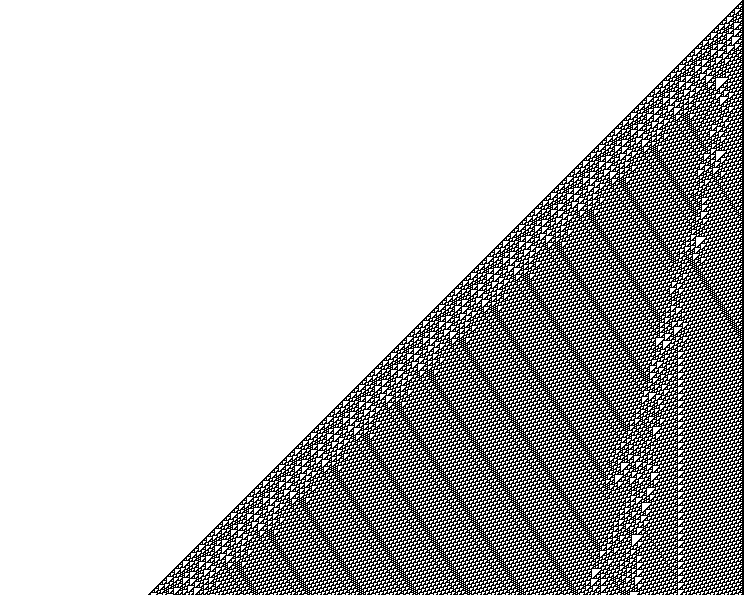
Figure 1: An example of elementary cellular automata following rule 110. Each row in the image represents a segment of time in a time series from top to bottom. Each back space represent an organism, and each white space represents a dead organism. By defining a rule set, we can determine the outcome of the system. Rule 110 is named as the binary equivalent to the binary series 01101110.
Elementary automata are particularly interesting for two reasons:
- The limited number of rules and interactions make them very easy to study.
- The visual nature of time allows for deep investigation into changing patterns.
With these two characteristics, elementary cellular automata have become a tool to explore emergence, chaos, and complexity in a non-linear system.
Read more...